Description
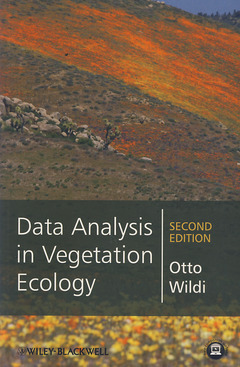
Data analysis in vegetation ecology (2nd Ed.)
Author: Wildi Otto
Language: English
Subject for Data analysis in vegetation ecology:
320 p. · 15.7x23.5 cm · Paperback
Description
/li>Contents
/li>Readership
/li>Biography
/li>
Preface to the first edition xv
List of figures xix
List of tables xxv
About the companion website xxvii
1 Introduction 1
2 Patterns in vegetation ecology 5
2.1 Pattern recognition 5
2.2 Interpretation of patterns 9
2.3 Sampling for pattern recognition 12
2.3.1 Getting a sample 12
2.3.2 Organizing the data 14
2.4 Pattern recognition in R 17
3 Transformation 23
3.1 Data types 23
3.2 Scalar transformation and the species enigma 26
3.3 Vector transformation 30
3.4 Example: Transformation of plant cover data 33
4 Multivariate comparison 37
4.1 Resemblance in multivariate space 37
4.2 Geometric approach 38
4.3 Contingency measures 43
4.4 Product moments 45
4.5 The resemblance matrix 48
4.6 Assessing the quality of classifications 50
5 Classification 53
5.1 Group structures 53
5.2 Linkage clustering 56
5.3 Average linkage clustering 59
5.4 Minimum–variance clustering 61
5.5 Forming groups 63
5.6 Silhouette plot and fuzzy representation 66
6 Ordination 71
6.1 Why ordination? 71
6.2 Principal component analysis 75
6.3 Principal coordinates analysis 82
6.4 Correspondence analysis 86
6.5 Heuristic ordination 89
6.5.1 The horseshoe or arch effect 89
6.5.2 Flexible shortest path adjustment 91
6.5.3 Nonmetric multidimensional scaling 93
6.5.4 Detrended correspondence analysis 95
6.6 How to interpret ordinations 96
6.7 Ranking by orthogonal components 100
6.7.1 RANK method 100
6.7.2 A sampling design based on RANK (example) 104
7 Ecological patterns 109
7.1 Pattern and ecological response 109
7.2 Evaluating groups 111
7.2.1 Variance testing 111
7.2.2 Variance ranking 115
7.2.3 Ranking by indicator values 117
7.2.4 Contingency tables 120
7.3 Correlating spaces 124
7.3.1 The Mantel test 124
7.3.2 Correlograms 127
7.3.3 More trends: ‘Schlaenggli’ data revisited 130
7.4 Multivariate linear models 134
7.4.1 Constrained ordination 134
7.4.2 Nonparametric multiple analysis of variance 141
7.5 Synoptic vegetation tables 146
7.5.1 The aim of ordering tables 146
7.5.2 Steps involved in sorting tables 147
7.5.3 Example: ordering Ellenberg’s data 151
8 Static predictive modelling 155
8.1 Predictive or explanatory? 155
8.2 Evaluating environmental predictors 156
8.3 Generalized linear models 159
8.4 Generalized additive models 164
8.5 Classification and regression trees 166
8.6 Building scenarios 169
8.7 Modelling vegetation types 171
8.8 Expected wetland vegetation (example) 176
9 Vegetation change in time 185
9.1 Coping with time 185
9.2 Temporal autocorrelation 186
9.3 Rate of change and trend 188
9.4 Markov models 192
9.5 Space–for–time substitution 199
9.5.1 Principle and method 199
9.5.2 The Swiss National Park succession (example) 203
9.6 Dynamics in pollen diagrams (example) 207
10 Dynamic modelling 213
10.1 Simulating time processes 214
10.2 Simulating space processes 222
10.3 Processes in the Swiss National Park 223
10.3.1 The temporal model 223
10.3.2 The spatial model 228
11 Large data sets: wetland patterns 233
11.1 Large data sets differ 233
11.2 Phytosociology revisited 235
11.3 Suppressing outliers 239
11.4 Replacing species with new attributes 241
11.5 Large synoptic tables? 245
12 Swiss forests: a case study 255
12.1 Aim of the study 255
12.2 Structure of the data set 256
12.3 Selected questions 258
12.3.1 Is the similarity pattern discrete or continuous? 258
12.3.2 Is there a scale effect from plot size? 262
12.3.3 Does the vegetation pattern reflect environmental conditions? 266
12.3.4 Is tree species distribution man–made? 270
12.3.5 Is the tree species pattern expected to change? 276
12.4 Conclusions 278
Bibliography 281
Appendix A Functions in package dave 293
Appendix B Data sets used 295
Index 297
|
Otto Wildi is from the WSL Swiss Federal Institute for Forest, Snow and Landscape Research, Birmensdorf, Switzerland.

