Description
Mastering Statistical Process Control
A Handbook for Performance Improvement Using Cases
Author: Stapenhurst Tim
Language: English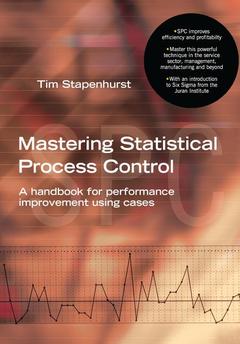
Subjects for Mastering Statistical Process Control:
Keywords
chart; out-of; conditions; limits; cusum; charts; warning; limit; range; run; MR Chart; Control Chart Signals; Average Run Length; Moving Range Chart; Cusum Charts; Control Chart; Jun Jul Aug Sep Oct; Lower Warning Limit; Out-of Control Conditions; Data Set; Vice Versa; Np Chart; Foot Drilled; LAL; Warning Limits; Range Chart; Multivariate Charts; Out-of Control Point; Run Chart; Out-of Control Signals; Attributes Charts; Difference Chart; Rods Experiment; Check Sheet; Bus Arrivals
Approximative price 154.17 €
In Print (Delivery period: 14 days).
Add to cart the book of Stapenhurst Tim
Publication date: 07-2016
· 17x24.5 cm · Hardback
Approximative price 45.04 €
Subject to availability at the publisher.
Add to cart the book of Stapenhurst Tim
Publication date: 03-2005
256 p. · Paperback
Description
/li>Contents
/li>Readership
/li>Biography
/li>Comment
/li>
Mastering Statistical Process Control shows how to understand business or process performance more clearly and more effectively. This practical book is based on a rich and varied selection of case studies from across industry and commerce, including material from the manufacturing, extractive and service sectors. It will enable readers to understand how SPC can be used to maximum effect, and will deliver more effective monitoring, control and improvement in systems, processes and management.
The common obstacle to successful use of SPC is getting bogged down with control charts, forgetting that visual representation of data is but a tool and not an end in itself. Mastering SPC demonstrates how statistical tools are applied and used in reality. This is a book that will open up the power of SPC for many: managers, quality professionals, engineers and analysts, as well as students, will welcome the clarity and explanation that it brings to understanding the use and benefit of SPC in a wide range of engineering, production and service situations.
Key case studies include using SPC to:
· Measure quality and human factors
· Monitor process performance accurately over long periods
· Develop best-practice benchmarks using control charts
· Maximise profitability of fixed assets
· Improve customer service and satisfaction
Part 1: Using & interpreting control charts; The old way: how & why moving averages mislead management; Part 2: Case Studies: Accounting for human error; Measuring quality & human factors; Measuring process performance accurately; Application of control charts to benchmarking; Coping with trends; How to draw two metrics on the same chart; Analysing production data; Celto-Styrocell case study; Training analysis using SPC; Using charts to maximise usage; Analysis of incidents; Exam results; Teaching people to draw control charts; Plotting the results of consecutive phases on a single chart; Budget vs actual plotting; Using charts to improve customer service; Estimating the cost of poor performance; Methods of sampling in complex systems; SPC in context: SPC, Six Sigma & Quality Management; Part 3: The Basics of SPC; Constructing charts; Interpreting charts; Examples & exercises